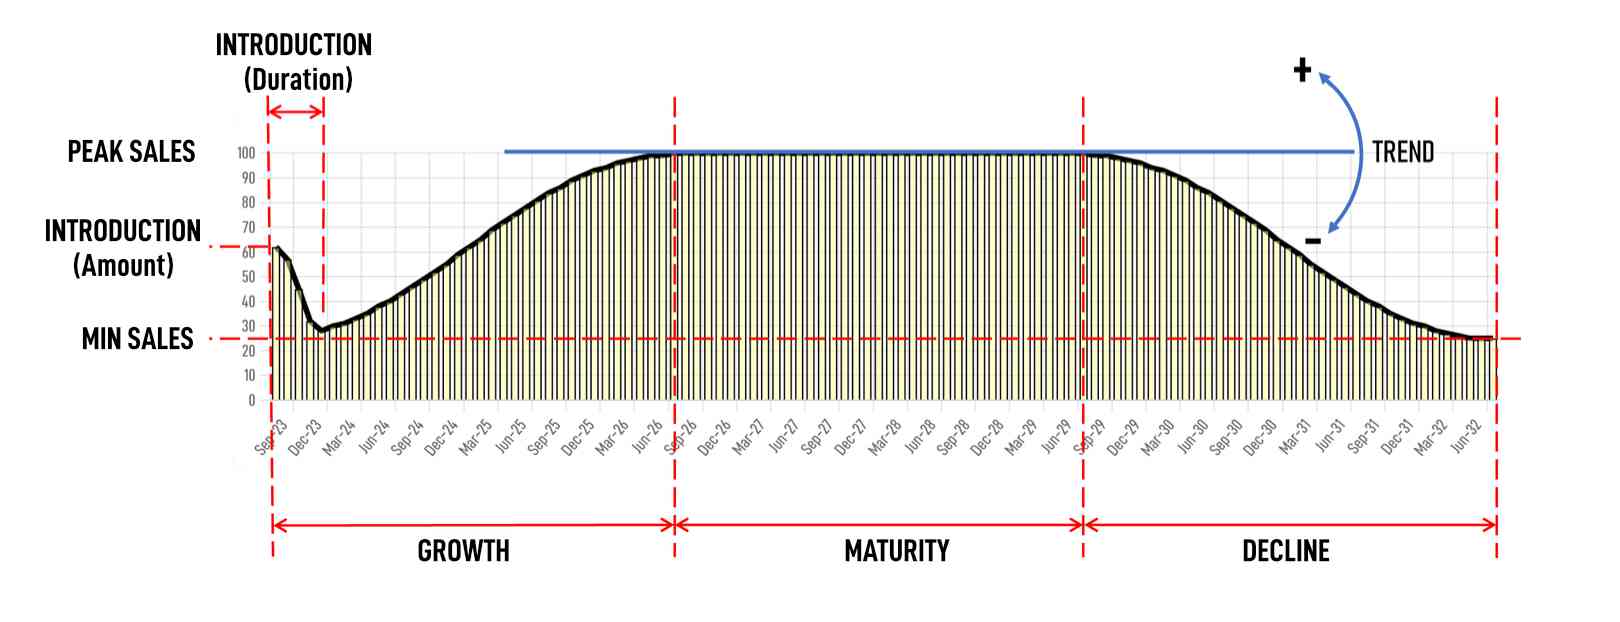
The PLC Curve uses eight key parameters which control the curve as follows:-
MIN SALES - The lowest number of units the product will sell per month.
PEAK SALES - The highest number of units the product will sell per month.
INTRODUCTION AMOUNT - A short term burst of sales, such as a load-in to a sales distribution network. The units are in % of PEAK SALES.
INTRODUCTION DURATION - The short term period, in months, for the load-in.
GROWTH - The amount of time, in months, that the product spends during the introduction into the market, and before the product experiences strong sales in the 'maturity' phase. During the growth phase, the product will gain market recognition and acceptance.
MATURITY - The amount of time, in months, that the product stays in the maturity phase of the product life cycle. It is generally the most profitable stage of the sales cycle, the time when the demand is greatest and costs of production are stable and declining. But as the market becomes saturated, competition will increase and demand will start to weaken, driving the product into the final stage of its life cycle.
DECLINE - The amount of time, in months, that product sales are in decline. Increased competition, alternative product offerings and saturation of the product means that market share will decline, driving sales ever lower. The next stage of the life cycle is end of life.
TREND - The overall trend for the curve either positive (increasing) or negative (decreasing) in % of sales.